Business Intelligence (BI) helps different organizations in better decision-making leveraging a wide range of latest tools and methods. It is the broadest category involving data analytics, data mining and big data. BI involves varied processes and procedures which help in data collection, sharing and reporting to ensure better decision making. With recent advancement in BI tools, users can generate reports and visualizations all by themselves.
Key Features
● With BI, you have the ability to predict trends based on historical data and trends.
● Better, data-informed decisions about sales, production, inventory, and distribution.
● Keeping Your Business on the Front Foot.
Business Intelligence & Odoo ERP System
Odoo provides a facility to represent data in a graphical and tabular format. There are two types of data representation in odoo.
Graph views: The graph view gives a way to look at your data and to visualize it in various ways. A graph is a another mode of view same as form and tree and it provides a graphical view of the data, in the form of a chart.
Types of graph:
Line chart
Bar chart
Pie chart
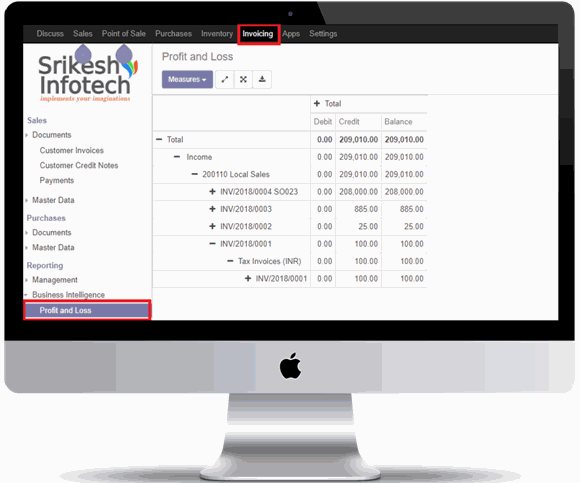
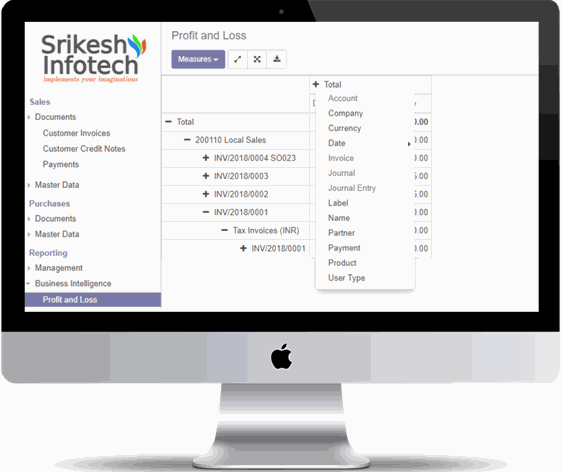
Pivot table: The basic use of pivot table is that you can select the desired dimensions, use the search bar to select appropriate filters, and switch to various chart modes.
You can re-organize and summarize selected columns and rows of data in a spreadsheet or database table to obtain a desired report. A pivot table doesn't actually change the spreadsheet or database itself. Its root element is <pivot>.
At SrikeshInfotech, We have focussed the same on "Financial Reports" in Pivot view to represent financial data as tables, a dynamic analysis matrix based on Account, Invoice, journals and so on.